")

Sunshine City Happiness Survey: Quarter One Results
 By: Julianna Kinser
Happiness Survey Intern & Eckerd College student
April 12, 2024 | Greetings, St. Petersburg! Here's the latest update from the Happiness Survey regarding the wellbeing of our community. Over the past few weeks, we've seen a steady rise in the average happiness rating, climbing from 3.13 to 4.83. Quite a notable increase! Since its launch three months ago, the survey has revealed significant fluctuations in wellbeing levels, peaking in late January and gradually stabilizing over time. Our research indicates a strong correlation between happiness and activities such as socializing at bars/restaurants or using public transit for leisure purposes. We're delving deeper into these connections and exploring additional factors.
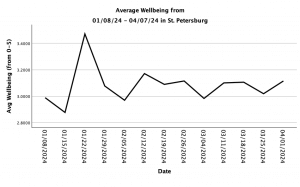
With baseball's opening week upon us, we anticipate that sporting events may have a significant impact on residents'
wellbeing. Additionally, weather remains a key contributing factor, and we're eager to uncover any links between weather patterns and our residents' moods as the survey progresses. We're constantly learning more from our participants, so stay tuned for further updates in the future!
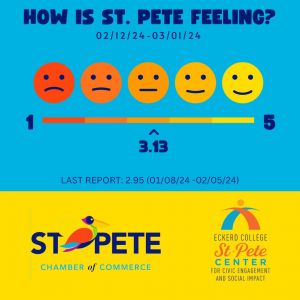
March 1, 2024 | Greetings, St. Petersburg! The happiness survey is progressing smoothly, and we're excited to provide an update. As indicated by the happiness meter, Wellbeing has risen by 6% since our last update.Upon delving deeper into the data, it appears that activities such as dining out and using public transportation for non-work purposes play significant roles in the wellbeing of our survey participants. Stay tuned for further updates in a few weeks to see how our St. Petersburg is faring then.
February 5, 2024 | Hello St. Pete! The Sunshine City Happiness Survey has officially ended its first month of data collection. We have learned so much already.
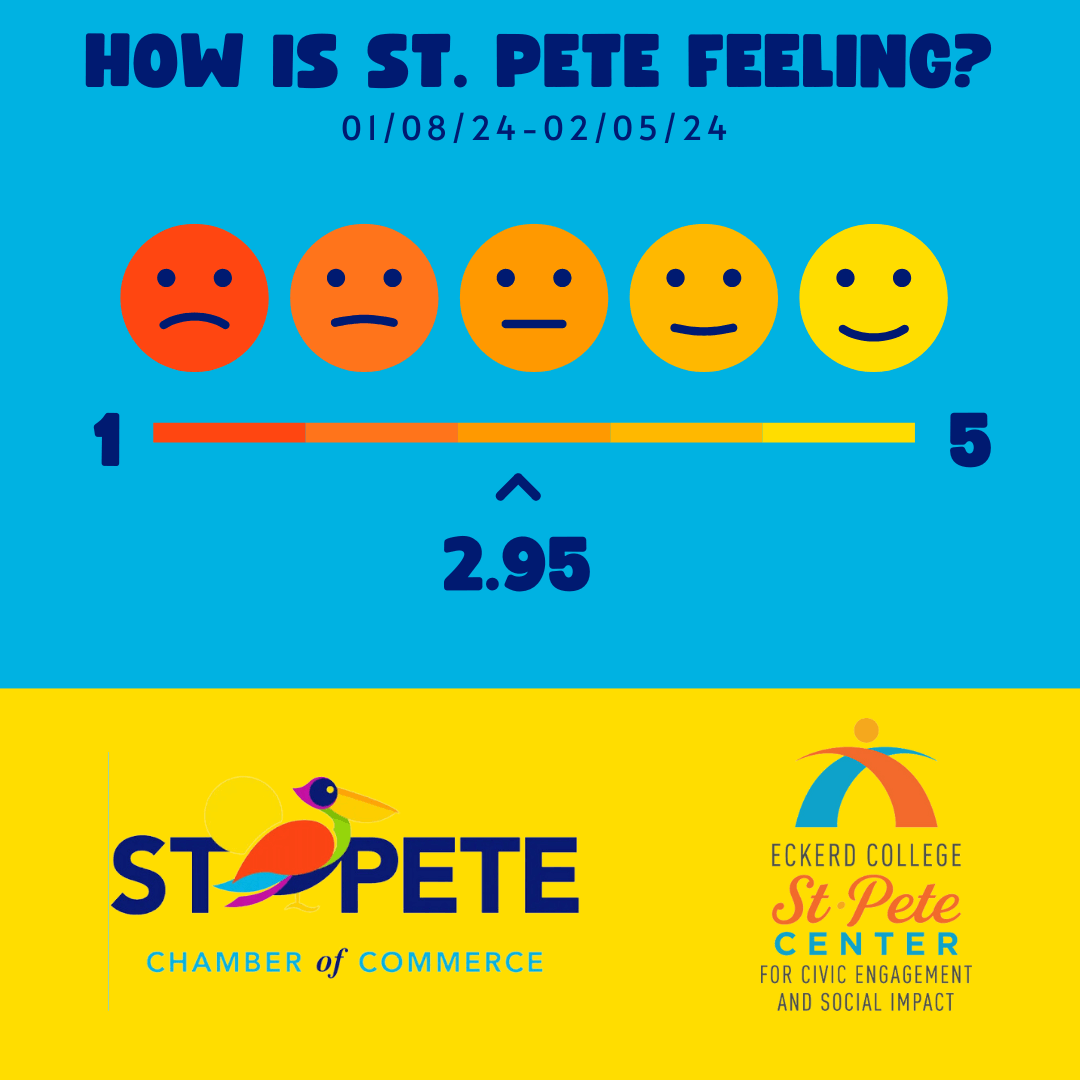
By taking the average of different emotions, we can quantify a happiness score for the past 4 weeks. Scores range from 1 to 5 with 1 being the least happiness and 5 being the most. The score for this month was a 2.95*. In addition to general happiness, we are asking questions about different factors that effect happiness. This month we focused heavily on commute time and traffic. Over the month, many respondents commuted at lightning speed. In fact, 82% of the responses from the month sat in the car for less than one way per day 30 min or worked from home. Our most committed traveler, 1 out of 266 responses, spent over 90 min on the road (ouch).

Further analysis may reveal a connection between commute and the happiness score we calculated. In future months, we hope to mix up the focus area exploring connections between happiness and childcare, time spend outdoors, and technology use at work.
Stay tuned for future updates on the survey and what else we can learn from our workers here in the Burg.
*=We calculate this score by taking the mean of the averages of each of the 4 weeks, adding 20, and diving by 8. This produces a value on a scale from 1 to 5.